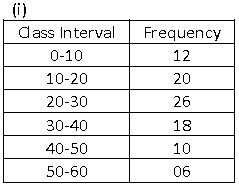
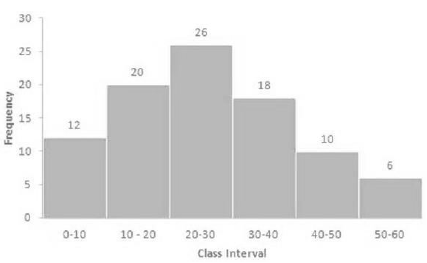
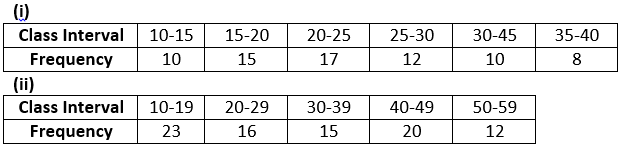
Question 1. Draw histogram for the following distributions:

Solution:


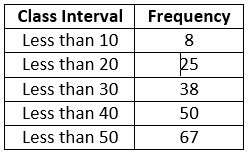
Question 2. Draw cumulative frequency curve (ogive) for each of the following distributions:
Solution:


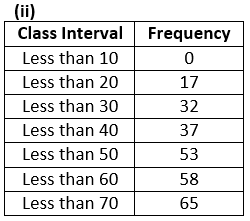
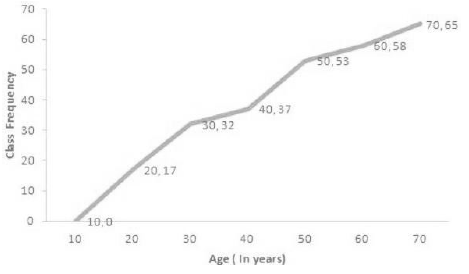
Question 3. Draw an ogive for each of the following distributions:

Solution:

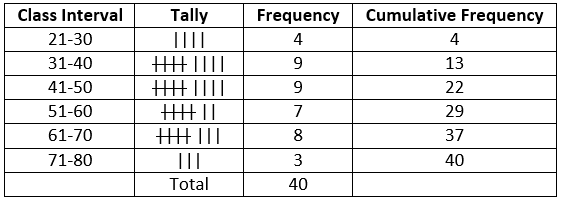
Question 4. Construct a frequency distribution table for the number given below, using the class intervals 21-30, 31-40 … etc. 75, 67, 57, 50, 26, 33, 44, 58, 67, 75, 78, 43, 41, 31, 21, 32, 40, 62, 54, 69, 48, 47, 51, 38, 39, 43, 61, 63, 68, 53, 56, 49, 59, 37, 40, 68, 23, 28, 36, 47
Use the table obtained to draw:
(i) a histogram
(ii) an ogive
Solution:

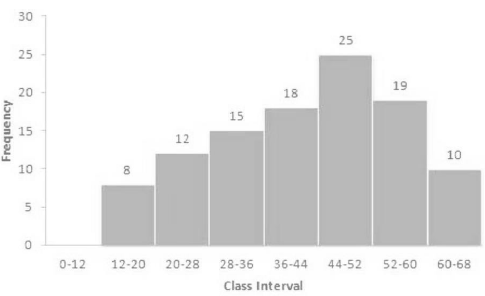
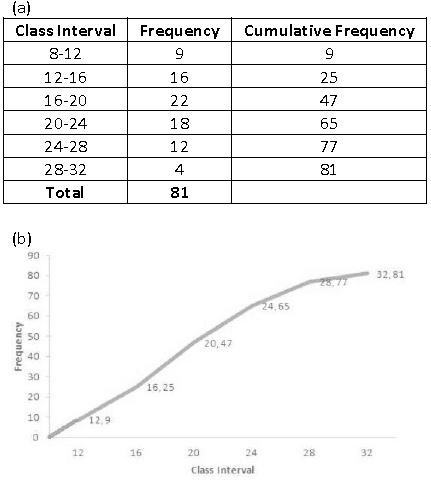
Question 5. (a) Use information given in the adjoining histogram to construct a frequency table.

(b) Use this table to construct an ogive.
Solution:
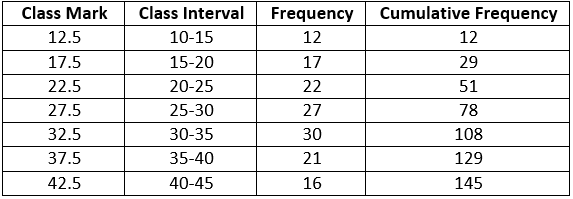
Question 6.

(a) From the distribution, given above, construct a frequency table.
(b) Use the table obtained in part (a) to draw; (i) a histogram (ii) an ogive.
Solution:
(a)
The difference in consecutive class = 17.5 – 12.5 = 5

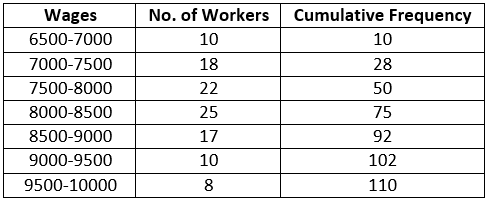
Question 7. Use graph paper for this question. The table given below shows the monthly wages of some factory workers.
(i) Using the table, calculate the cumulative frequencies of workers.
(ii) Draw a cumulative frequency curve.
Use 2cm = Rs. 500 starting the origin at Rs. 6500 on x-axis and 2cm = 10 workers on the y-axis.

Solution:

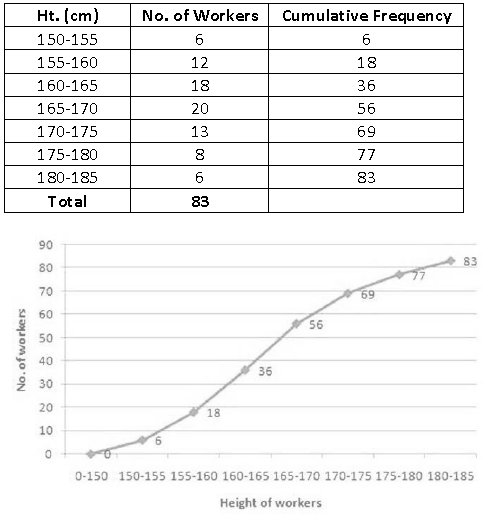
Question 8. The following table shows the distribution of the height of a group of factory workers:

(i) Determine the cumulative frequencies.
(ii) Draw the ‘less than’ cumulative frequency curve on graph paper. Use 2cm = 5cm height on one axis and 2cm = 10 workers on the other.
Solution:
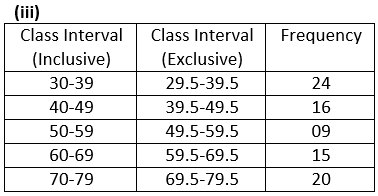
Question 9. Construct a frequency distribution table for each of the following distributions:

Solution: