Question 1. Find the mean of the following set of numbers:
(i) 6, 9, 11, 12 and 7
(ii) 11, 14, 23, 26, 10, 12, 18 and 6
Solution:

Question 2. Marks obtained (in mathematics) by 9 student are given below: 60, 67, 52, 76, 50, 51, 74, 45 and 56
(i) Find the arithmetic mean
(ii) If marks of each student be increased by 4; what will be the new value of arithmetic mean.
Solution:

(b) We know that, if the value of each number is increased by n then arithmetic mean also increased by n.
If marks of each student be increased by 4
New arithmetic mean = 59 + 4
New arithmetic mean = 63
Question 3. Find the mean of the natural numbers from 3 to 12.
Solution:
Natural numbers from 3 to 12 is
3, 4, 5, 6, 7, 8, 9, 10, 11 and 12.
n =10

Question 4. Find the mean of 7, 11, 6, 5, and 6.
If each number given in (a) is diminished by 2, find the new value of mean.
Solution:
(a) The mean of 7, 11, 6, 5 and 6

(b) We know that, if the value of each number is diminished by n then arithmetic mean also diminished by n.
Each number is diminished by 2
New arithmetic mean = 7 – 2
New arithmetic mean = 5
Question 5. If the mean of 6, 4, 7, ‘a’ and 10 is 8. Find the value of ‘a’.
Solution:
It is given that,
No. of terms = 5
Mean x̄ = 8

Sum of numbers is 40.
Sum of numbers = 6 + 4 + 7 + a + 10
Sum of numbers = 27 + a
40 = 27 + a
a = 40 – 27
a =13
Hence, the value of a is 13.
Question 6. The mean of the number 6, ‘y’, 7, ‘x’ and 14 is 8. Express ‘y’ in terms of ‘x’.
Solution:
It is given that,
No. of terms = 5
Mean x̄ = 8

Sum of numbers is 40.
Sum of numbers = 6 + y + 7 + x +1 4
Sum of numbers = 27 + y + x
27 + y + x = 40
x + y =13
y = 13 – x
Hence, the ‘y’ in terms of ‘x’ is y = 13 – x.
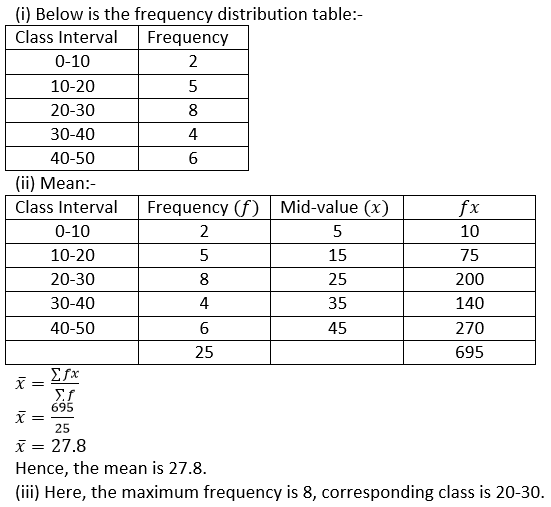
Question 7. The ages of 40 students are given in the following table:

Solution:

Question 8. If 69.5 is the mean of 72, 70, x, 62, 50, 71, 90, 64, 58 and 82, find the value of ‘x’.
Solution:
It is given that,
No. of terms = 10
Mean x̄ = 69.5

Σ 𝑥 = 69.5 × 10
Σ 𝑥 = 695
Sum of the numbers is 695.
Sum of numbers = 72 + 70 + 𝑥 + 62 + 50 + 71 + 90 + 64 + 58 + 82
Sum of numbers = 619 + 𝑥
695 = 619 + 𝑥
𝑥 = 695 − 619
𝑥 = 76
Hence, the value of 𝑥 is 76.
Question 9. The following table gives the heights of plants in centimeter. If the mean height of plants is 60.95cm; find the value of ’f’.

Solution:

60.95(28 + 𝑓) = 1718 + 60𝑓
60.95(28 + 𝑓) = 1718 + 60𝑓
1706.6 + 60.95𝑓 = 1718 + 60𝑓
60.95𝑓 − 60𝑓 = 1718 − 1706.6
0.95𝑓 = 11.4
𝑓 = 11.4/0.95
𝑓 = 12
Hence, the value of 𝑓 is 12.
Question 10. From the data given below, calculate the mean wage, correct to the nearest rupee.

(i) If the number of workers in each category is doubled, what would be the new mean wage?
(ii) If the wages per day in each category are increased by 60%; what is the new mean wage?
(iii) If the number of workers in each category is doubled and the wages per day per worker are reduced by 40%, what would be the new mean wage?
Solution:

(i) If the number of workers in each category is doubled, the new mean wage is same as earlier 80. (ii) If the wages per day in each category are increased by 60%, the new mean wage is also increased by 160%.

(iii) If the number of workers in each category is doubled there is no change in the mean but if the wages per day per worker are reduced by 40%

Question 11. The contents of 100 match boxes were checked to determine the number of matches they contained.

(i) Calculate, correct to one decimal place, the mean number of matches per box.
(ii) Determine how many extra matches would have to be added to the total contents of the 100 boxes to bring the mean up to exactly 39 matches.
Solution:

Total contents = 3900
Total No. of matches already given = 3813
Number of new matches to be added = 3900 – 3813
Number of new matches to be added = 87
Hence, the number of new matches to be added is 87.
Question 12. If the mean of the following distribution is 3, find the value of p.
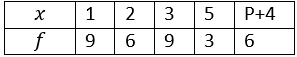
Solution:

Question 13. In the following table, and mean = 73. Find the missing frequencies and .

Solution:
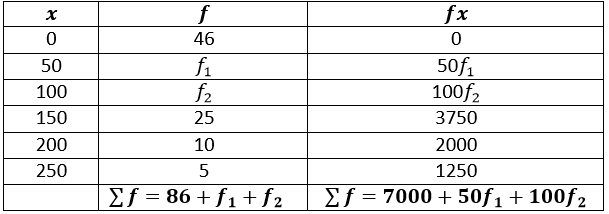
It is given, Σ 𝑓 = 200 and the mean is 73.
86 + 𝑓1 + 𝑓2 = 200
𝑓1 + 𝑓2 = 200 − 86
𝑓1 + 𝑓2 = 114 … … . . (𝑖)
From equation (i) get the value of 𝑓1
𝑓1 + 𝑓2 = 114
𝑓1 = 114 − 𝑓2 … … . . (𝑖𝑖)
Now,

7000 + 50𝑓1 + 100𝑓2 = 73 × 200
7000 + 50𝑓1 + 100𝑓2 = 14600
50𝑓1 + 100𝑓2 = 14600 − 7000
50(𝑓1 + 2𝑓2) = 7600
𝑓1 + 2𝑓2 = 7600/50
𝑓1 + 2𝑓2 = 152 … … . (𝑖𝑖𝑖)
Put the value of 𝑓1 in equation (𝑖𝑖𝑖)
𝑓1 + 2𝑓2 = 152
114 − 𝑓2 + 2𝑓2 = 152
𝑓2 = 152 − 114
𝑓2 = 38
Put the value of 𝑓2in equation (𝑖𝑖)
𝑓1 = 114 − 𝑓2
𝑓1 = 114 − 38
𝑓1 = 76
Hence, the value of 𝑓1 is 76 and 𝑓2 is 38.
Question 14. Find the arithmetic mean (correct to the nearest whole-number) by using step-deviation method.

Solution:
By Step deviation method:-

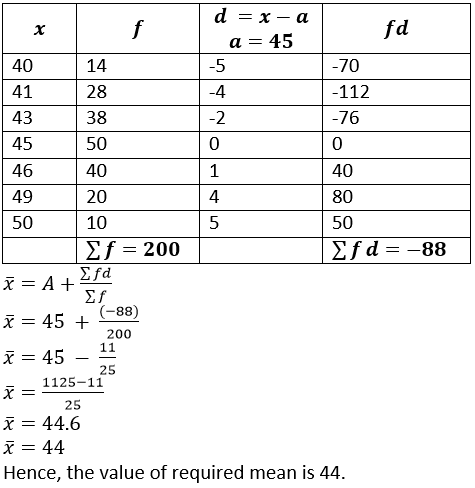
Question 15. Find the mean (correct to one place of decimal) by using short-cut method.

Solution:
By short-cut method:-
Exercise 24B
Question 1.The following table gives the ages of 50 students of a class. Find the arithmetic mean of their ages.

Solution:

Question 2. The Following table Gives weekly wages of workers in a factory.

Calculate the mean by using:
(i) Direct Method
(ii) Short – cut Method
Solution:
(i) By Direct method:-


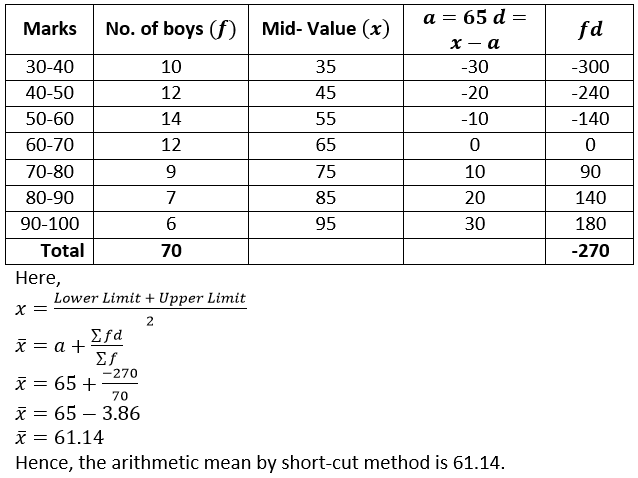
Question 3. The following are the marks obtained by 70 boys in a class tests:

Solution:
(i) Short- Cut method

Question 4. Find mean by step- deviation method:

Solution:

Question 5. The mean of the following frequency distribution is 21(1/7). Find the value of “f”


Question 6. Using short-cut method, calculate the mean marks of the following distribution.

Solution:

Question 7. Using the information given in the adjoining histogram, calculate the mean.

Solution:

Question 8. If the mean of the following observations is 54, find the value of ‘p’.

Solution:

By cross multiplication,
54(39 + 𝑝) = 2370 + 30𝑝
2106 + 54𝑝 = 2370 + 30𝑝
54𝑝 − 30𝑝 = 2370 − 2106
24𝑝 = 264
𝑝 = 264/24
𝑝 = 11
Hence, the value of 𝑝 is 11.
Question 9. The mean of the following distribution is 62.8 and the sum of the frequencies is 50. Find the missing frequencies f1 and f2.

Solution:

By cross multiplication,
2060 + 30𝑓1 + 70𝑓2 = 62.8 × 50
2060 + 30𝑓1 + 70𝑓2 = 3140
30𝑓1 + 70𝑓2 − 1080
10(3𝑓1 + 7𝑓2 − 108) = 0
3𝑓1 + 7𝑓2 − 108 = 0 … … … (𝑖𝑖)
Put the value of𝑓1 in equation (𝑖𝑖)
3(20 − 𝑓2) + 7𝑓2 − 108 = 0
60 − 3𝑓2 + 7𝑓2 − 108 = 0
60 − 3𝑓2 + 7𝑓2 − 108 = 0
−3𝑓2 + 7𝑓2 − 32 = 0
4𝑓2 = 32
𝑓2 = 32/4
𝑓2 = 8
Put the value of 𝑓2 in equation (𝑖)
𝑓1 = 20 − 𝑓2
𝑓1 = 20 − 8
𝑓1 = 12
Hence, the value of 𝑓1 is 8 and 𝑓2 is 12.
Question 10. Calculate the mean of the distribution, given below, using the short cut method:

Solution:

Question 11. Calculate the mean of the following distribution:

Solution:

Exercise 24C
Question 1. A student got the following marks in 9 questions of a paper. 3, 5, 7, 3, 8, 0, 1, 4 and 6. Find the median of these marks.
Solution:
Arrange in ascending order 0, 1, 3, 3, 4, 5, 6, 7, 8.
Here, N (count of number) is 9 an odd number

Question 2. The weights (in kg) of 10 students of a class are given below: 21, 28.5, 20.5, 24, 25.5, 22, 27.5, 28, 21 and 24. Find the median of their weights.
Solution:
Arrange in ascending order 20.5, 21, 21, 22, 24, 24, 25.5, 27.5, 28, 28.5
Here N (count of number) is 10 even number.

Question 3. The marks obtained by 19 students of a class are given below:
27, 36, 22, 31, 25, 26, 33, 24, 37, 32, 29, 28, 36, 35, 27, 26, 32, 35 and 28.
Find:
(i) Median
(ii) Lower quartile
(iii) Upper quartile
(iv) Interquartile range
Solution:
Arrange in ascending order 22, 24, 25, 26, 26, 27, 27, 28, 28, 29, 21, 32, 32, 33, 35, 35, 36, 36, 37
(i) Here, N (count of number) is 19 an odd number.

(iv) Interquartile Range = Q3-Q1
Interquartile Range = 35 – 26
Interquartile Range = 9
Hence, the Interquartile Range is 35.
Question 4. From the following data, find: Median, Upper quartile, Inter-quartile range
25, 10, 40, 88, 45, 60, 77, 36, 18, 95, 56, 65, 7, 0, 38 and 83
Solution:
Arrange in ascending order 0, 7, 10, 18, 25, 36, 38, 40, 45, 56, 60, 65, 77, 83, 88, 95
Interquartile Range = 𝑄3 − 𝑄1
Interquartile Range = 65 – 18
Interquartile Range = 47
Hence, the Interquartile Range is 47.
Question 5. The age of 37 students in a class are given in the following table:

Find the median.
Solution:

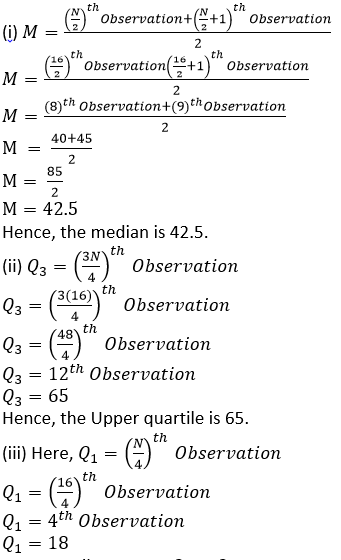
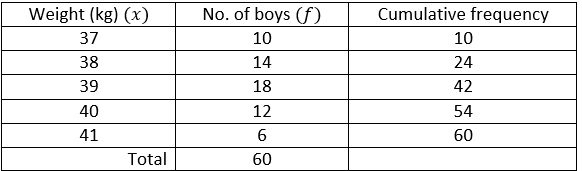
Question 6. The weight of 60 boys are given in the following distribution table:

(i) Median
(ii) Lower quartile
(iii) Upper quartile
(iv) Interquartile range
Solution:

(iv) Interquartile Range = 𝑄3 − 𝑄1
Interquartile Range = 40 – 38
Interquartile Range = 2
Hence, the Interquartile Range is 2.
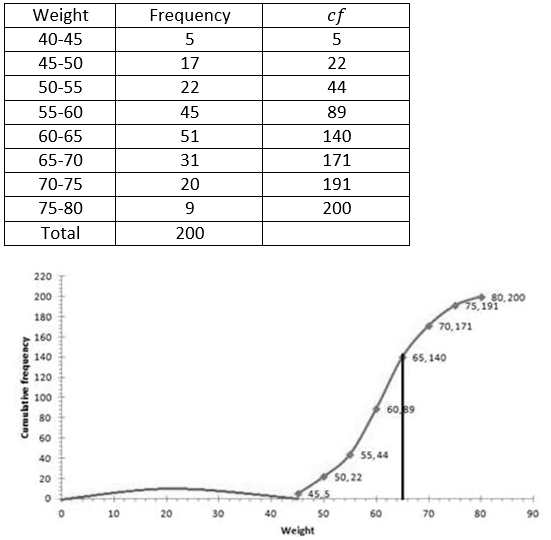
Question 7. Estimate the median for the given Data by drawing an ogive:

Solution:

Plot 25.5 on y-axis, now draw a line to x-axis. Meets the curve at A draw a perpendicular to x- axis, which meets x-axis at B.
Question 8. By drawing an o-give, estimate the median for the following frequency distribution:

Solution:

Plot 28 on the y-axis, draw a line parallel to x-axis meets the curve at A. Meets the curve at A, and draw a perpendicular to x-axis, which meets x- axis to B. The value of B is the median which is 18.4 kg.
Question 9. From the following cumulative frequency table, find:
(i) Median
(ii) Lower Quartile
(iii) Upper Quartile

Solution:

(i) Median = Plot 40 on the y-axis, draw a line parallel to x-axis meets the curve at A. Meet the curve at B, and draw a draw a perpendicular to x-axis which meets it at B. the value of B is the median which is 40.
(ii) lower quartile (Q1) = Plot 20 on the y-axis, draw a line parallel to x-axis meets the curve at A. Meet the curve at B, and draw a draw a perpendicular to x-axis which meets it at B. the value of B is the lower quartile which is 18.
(iii) Upper Quartile (Q3) = Plot 40 on the y-axis, draw a line parallel to x-axis meets the curve at A. Meet the curve at B, and draw a draw a perpendicular to x-axis which meets it at B. the value of B is the Upper Quartile which is 40.
Question 10. In a school, 100 pupils have heights as tabulated below:

Solution:
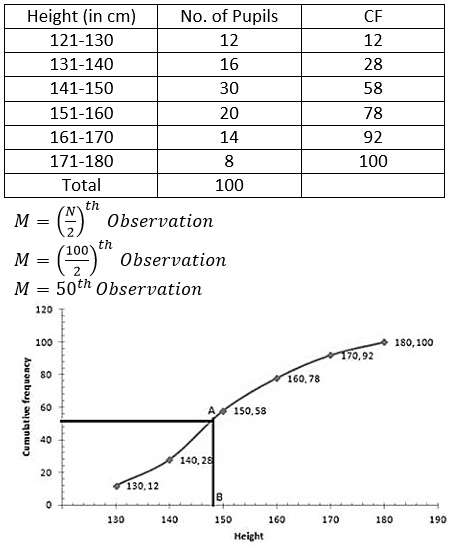
Plot 50 on the y-axis, draw a line parallel to x-axis meets the curve at A. Meets the curve at A, and draw a perpendicular to x-axis, which meets x- axis to B. The value of B is the median which is 148.
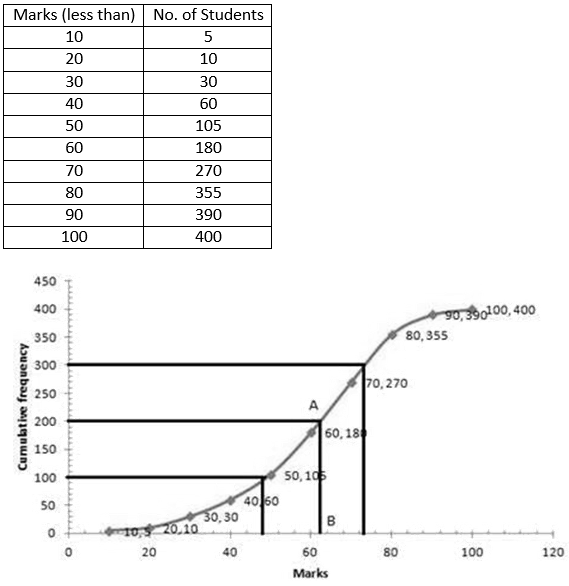
Question 11. Attempt this question on a graph paper. The table shows the distribution of marks gained of 400 students in an examination

Using a scale of 2cm to represent 10 marks and 2cm to represent 50 students, plot these points and draw a smooth curve through the points.
Estimate from the graph:
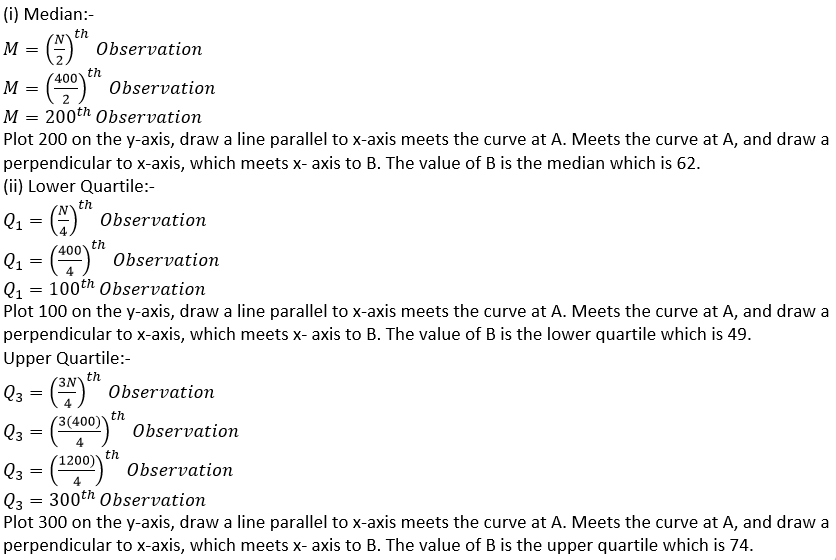
(i) the median marks
(ii) the quartile marks
Solution:
Question 12. Attempt this question on graph paper.

(i) Construct the ‘less than’ cumulative frequency curve for the above data. Using 2cm = 10 years on one axis 2cm = 10 casualties on the other.
(ii) From your graph determine:
(a) the median
(b) the lower quartile
Solution:
(i)

Exercise 24D
Question 1. Find the mode of the following data:
(i) 7, 9, 8, 7, 7, 6, 8, 10, 7 and 6
(ii) 9, 11, 8, 11, 16, 9, 11, 5, 3, 11, 17 and 8
Solution:
(i) Here 7 is occurs 4 times, Hence the mode is 7.
(ii) Here 11 is occurs 4 times, Hence the mode is 11.
Question 2. The following table shows the frequency distribution of heights 50 boys:

Find the mode of heights.
Solution:
Here, Maximum number of frequency is 18, hence the mode is 122.
Question 3. Find the mode of following data, using a histogram:

Solution:
Question 4. The following table shows the expenditure of 60 boys on books. Find the mode of their expenditure:

Solution:

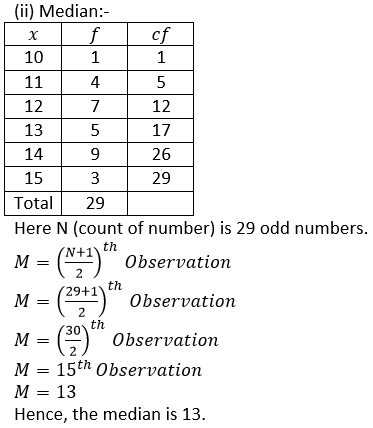
Question 5. Find the median and mode for the set of numbers: 2, 2, 3, 5, 5, 5, 6, 8 and 9
Solution:
Median:-
Here N is 9.

Question 6. A boy scored following marks in various class tests during a term; each test being marked out of 20.
15, 17, 16, 7, 10, 12, 14, 16, 19, 12 and 16.
(i) What are his modal marks?
(ii) What are his median marks?
(iii) What are his total marks?
(iv) What are his mean marks?
Solution:
Arranging the data in ascending order:- 7, 10, 12, 12, 14, 15, 16, 16, 16, 17, 19
(i) Here, 16 is occurs 3 times which is highest, Hence the mode is 16.

Question 7. Find the mean, median and mode of the following marks obtained by 16 students in a class test marked out of 10 marks. 0, 0, 2, 2, 3, 3, 3, 4, 5, 5, 5, 5, 6, 6, 7 and 8.
Solution:
(i) Mean:-

Question 8. At a shooting competition the score of a competitor were as given below:

(i) What was his modal score?
(ii) What was his median score?
(iii) What was his total score?
(iv) What was his mean score?
Solution:

Exercise 24E
Question 1. The following distribution represents the height of 160 students of a school.

Draw an ogive for the given distribution taking 2cm = 5cm of height on one axis and 2cm = 20 students on the other axis. Using the graph, Determine:
(i) The median height.
(ii) The interquartile range.
(iii) The number of students whose height is above 172 cm.
Solution:
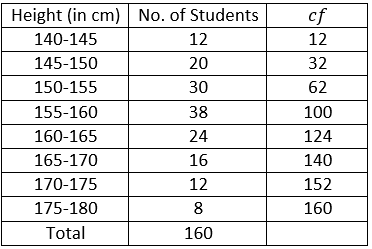


Plot 120 on the y-axis, draw a line parallel to x-axis meets the curve at A. Meets the curve at A, and draw a perpendicular to x-axis, which meets x- axis to B. The value of B is the upper quartile which is 164.
Interquartile range = Q3-Q1
Interquartile range = 164-152
Interquartile range = 12
(iii) Plot 172 on the x-axis, draw a line perpendicular to x-axis meets the curve at A. Meets the curve at A, and draw a perpendicular to y-axis, which meets x- axis to B. The value of B is the median which is 145.
Hence, the number of students whose height is above 172cm = 160 – 144 =16
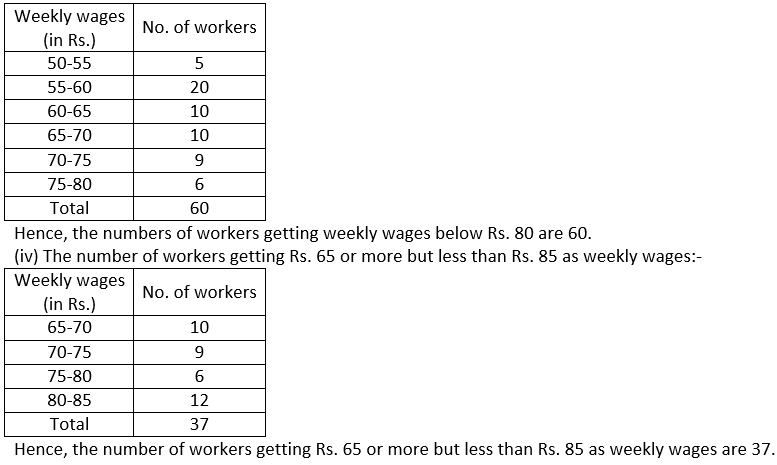
Question 2. The following table gives the weekly wages of workers in a factory:

Calculate: (i) the mean, (ii) the modal class, (iii) the number of workers getting weekly below Rs. 80 and (iv) the number of workers getting Rs. 65 or more but less than Rs. 85 as weekly wages.
Solution:

(ii) The maximum frequency is 20. So, the Modal class is 55 – 60.
(iii) The number of workers getting weekly below Rs. 80:-
Question 3. Draw an ogive for the data given below and from the graph determine;
(i) The median marks
(ii) The number of students who obtained more than 75% marks
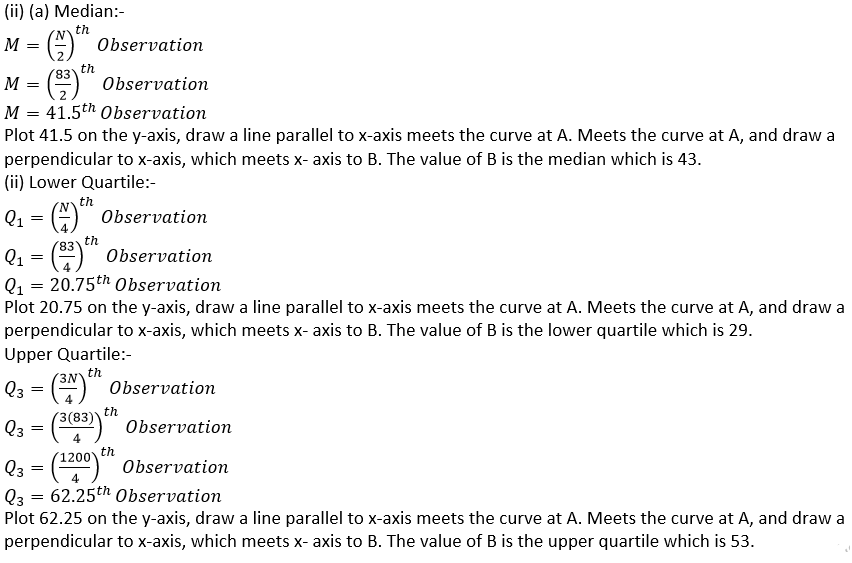
Solution:


𝑀 = 60𝑡ℎ 𝑂𝑏𝑠𝑒𝑟𝑣𝑎𝑡𝑖𝑜𝑛
Plot 60 on the y-axis, draw a line parallel to x-axis meets the curve at A. Meets the curve at A, and draw a perpendicular to x-axis, which meets x- axis to B. The value of B is the median which is 43.
(ii) It is given that total marks = 100
75% of total marks = 100 × 75/100
75% of total marks = 75
The number of students getting more than 75% marks = 120 – 111 = 9
Question 4. The mean of 1, 7, 5, 3, 4 and 4 is m. The numbers 3, 2, 4, 2, 3, 3 and p have mean m-1 and median.
Find p and q.
Solution:
It is given that, the mean of 1, 7, 5, 3, 4, 4 is m.

Median = 3
q=3
Hence, the value of p is 4 and q is 3
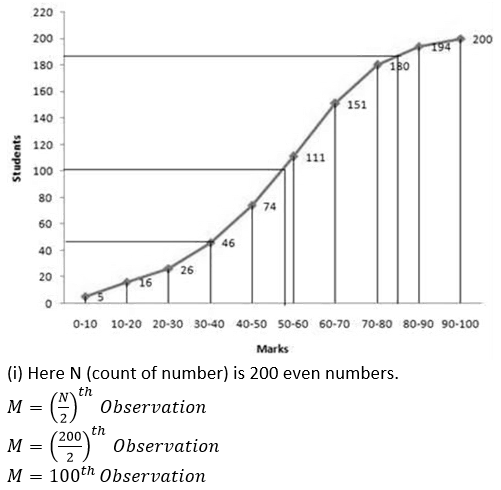
Question 5. The marks of 200 students in a test were recorded as follows:

Construct the cumulative frequency table. Draw the ogive and use it to find:
(i) the median and
(ii) the number of students who score more than 35% marks.
Solution:


M = 100th Observation
Plot 100 on the y-axis, draw a line parallel to x-axis meets the curve at A. Meets the curve at A, and draw a perpendicular to x-axis, which meets x- axis to B. The value of B is the median which is 52.5.
(ii) It is given that total marks = 100
35% of total marks = 100×35/100
35% of total marks = 35
The number of students getting more than 75% marks = 200 – 28 = 172
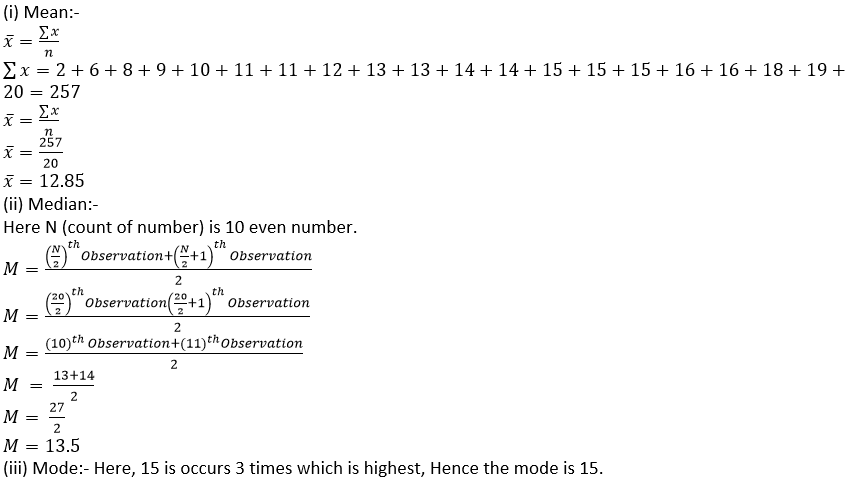
Question 6. The marks of 20 students in a test were as follows:
2, 6, 8, 9, 10, 11, 11, 12, 13, 13, 14, 14, 15, 15, 15, 16, 16, 18, 19 and 20.
Calculate:
(i) the mean (ii) the median (iii) the mode
Solution:
Question 7. The mark obtained by 120 students in a mathematics test is given below:

Draw an ogive for the given distribution on a graph sheet. Use a suitable scale for your ogive. Use your ogive to estimate:
(i) the median
(ii) the number of students who obtained more than 75% in test.
(iii) the number of students who did not pass in the test if the pass percentage was 40.
(iv) the lower quartile
Solution:
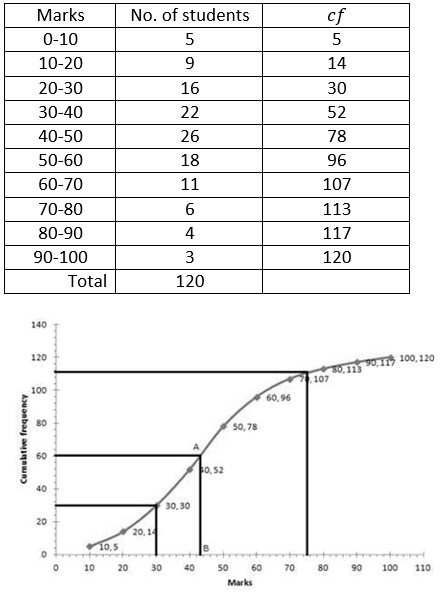
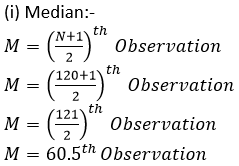
Plot 60.5 on the y-axis, draw a line parallel to x-axis meets the curve at A. Meets the curve at A, and draw a perpendicular to x-axis, which meets x- axis to B. The value of B is the median which is 43.
(ii) It is given that total marks = 110
75% of total marks = 100×75/100
75% of total marks = 75
The number of students getting more than 75% marks = 120 – 110 = 10
(iii) Number of students who obtained less than 40% marks in the test = 52
(iv) Lower Quartile:-
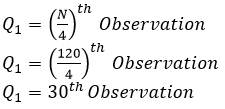
Plot 30 on the y-axis, draw a line parallel to x-axis meets the curve at A. Meets the curve at A, and draw a perpendicular to x-axis, which meets x- axis to B. The value of B is the lower quartile which is 30.
Question 8. Using a graph paper, draw an ogive for the following distribution which shows a record of the width in kilograms of 200 students.

Use your ogive to estimate the following:
(i) The percentage of students weighing 55kg or more.
(ii) The weight above which the heaviest 30% of the student fall.
(iii) The number of students who are
(a) underweight
(b) overweight
If 55.70kg is considered as standard weight.
Solution:
(i) Students having weight more than 55kg.
Weight more than 55kg. = 200 – 44
Weight more than 55kg. = 156
Percentage of Weight more than 55kg.:-

(iii) (a) Underweight students when 55.70kg is standard approx. 46 students.
(b) Overweight students when 55.70kg is standard 200 – 55.70 = 154.
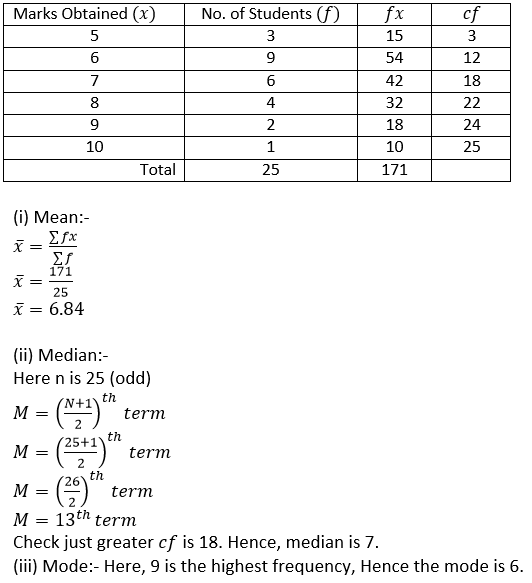
Question 9. The distribution, given below, shows the marks obtained by 25 students in an aptitude test. Find the mean, median and mode of the distribution.

Solution:
Question 10. The mean of the following distribution is 52 and the frequency of class interval 30-40 is ‘f’. Find f.

Solution:-
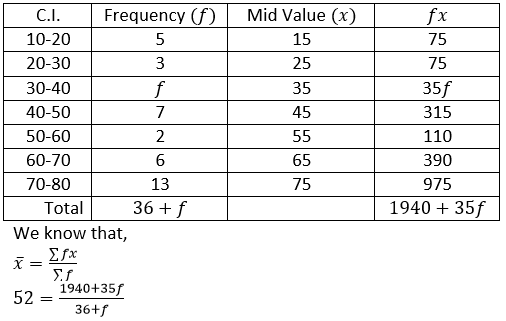
By cross multiplication,
52(36+f)=1940+35f
1872+52f=1940+35f
52f-35f=1940-1872
17f=68
f=4
Hence, the value of f is 4.
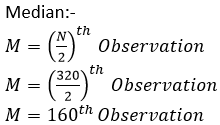
Question 11. The monthly income of a group of 320 employees in a company is given below:
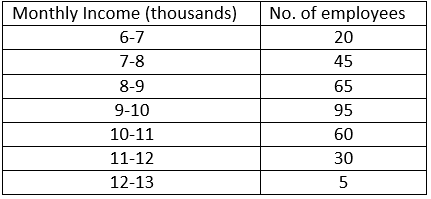
Draw an ogive of the given distribution on a graph paper taking 2cm = Rs. 1000 on one axis and 2cm = 50 employees on the other axis. From the graph determine.
(i) the median wage
(ii) number of employees whose income is below Rs. 8500.
(iii) it salary of a senior employee is above Rs. 11,500. Find the number of senior employees in the company.
(iv) the upper quartile.
Solution:-

Plot 160 on the y-axis, draw a line parallel to x-axis meets the curve at A. Meets the curve at A, and draw a perpendicular to x-axis, which meets x- axis to B. The value of B is the median which is 9.3.
(ii) Plot 8500 on the x-axis, draw a line horizontal line to y-axis meets the curve at A. Meets the curve at A, and draw a perpendicular to y-axis, which meets x- axis to B. The value of B is 95. Hence, the number of employees with income below Rs. 8500 is 95.
(iii) Plot 11500 on the x-axis, draw a line horizontal line to y-axis meets the curve at A. Meets the curve at A, and draw a perpendicular to y-axis, which meets x- axis to B. The value of B is 305. Hence, the number of employees with income below Rs. 11500 is 305. Number of senior employees is 320 – 305 = 15.

Plot 320 on the y-axis, draw a line parallel to x-axis meets the curve at A. Meets the curve at A, and draw a perpendicular to x-axis, which meets x- axis to B. The value of B is the median which is 10,300.
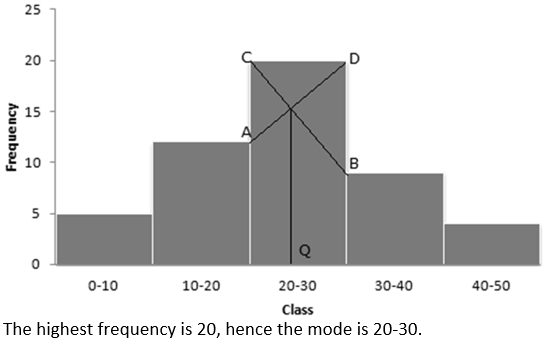
Question 12. A mathematics aptitude test of 50 students was recorded was recoded as follows:

Draw a histogram for the above data using a graph paper and locate the mode.
Solution:
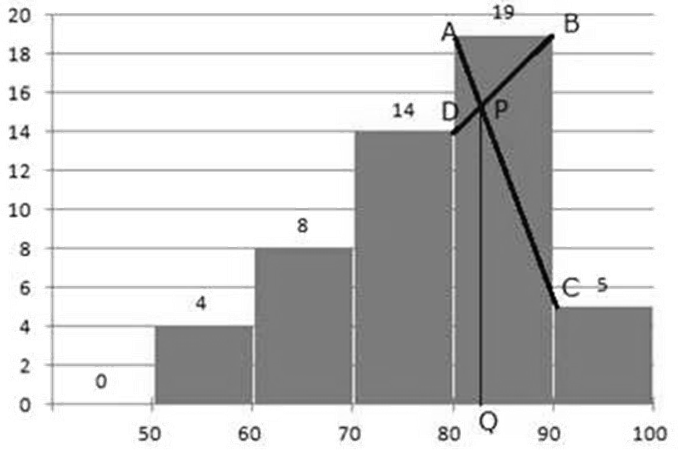
Draw two lines AC and BD intersecting at P in the topmost rectangle, which denotes modal class. Draw a perpendicular to the x-axis line from P to Q. The mean value of Q is 82.
Question 13. Marks obtained by 200 students in an examination are given below:

Draw an ogive of the given distribution on a graph paper taking 2cm = 10 marks on one axis and 2cm = 20 students on the other axis. Using the graph:
(i) the median wage.
(ii) number of students who failed if minimum marks required to pass is 40.
(iii) if scoring 85 and more marks is considered as grade one, find the number of students who secured grade on in the examination.
Solution:

Plot 100 on the y-axis, draw a line parallel to x-axis meets the curve at A. Meets the curve at A, and draw a perpendicular to x-axis, which meets x- axis to B. The value of B is the median which is 57.
(ii) The number of students who failed = 46.
(iii) The number of students who secured grade one in the examination 200 – 188 = 12
Question 14. The marks obtained by 40 students in a short assessment is given below, where a and b are two missing data.

If mean of the distribution is 7.2, find a and b.
Solution:
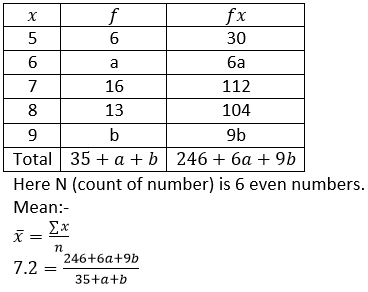
By cross multiplication,
7.2 (35 + a + b) = 246 + 6a + 9b
252 + 7.2a + 7.2b = 246 + 6a + 9b
7.2a – 6a + 7.2b – 9b = 246 – 252
1.2a – 1.8b =-6………….(1)
It is given that,
Total number of students is 40.
40 = 35+a+b
40 – 35 = a + b
a + b = 5
a = 5 – b………….(2)
Put the value of b in equation (1)
1.2(5-b)-1.8b=-6
6-1.2b-1.8b=-6
-3b=-6-6
-3b=-12
b=4
Put the value of b in equation (2)
a=5-4
a=1
Hence, the value of a is 1.
Question 15. Find the mode and the median of the following frequency distribution.

Solution:
(i) Mode:- Here, 7 is the highest frequency, hence the corresponding x will be mode is 12.
Question 16. The median of the observations 11, 12, 14, (x – 2) (x + 4), (x + 9), 32, 38, 47 arranged in ascending order is 24. Find the value of x and hence find the mean.
Solution:
The data already arrange in ascending order:
11,12,14,(x–2),(x+4),(x+9),32,38,47
Here N (count of number) is 9 odd numbers.

Question 17. The number 6, 8, 10, 12, 13 and x are arranged in an ascending order. If the mean of the observations is equal to the median, find the value of x.
Solution:
It is given that,
Ascending order 6, 8, 10, 12, 13 and x
Here N (count of number) is 6 even numbers.

Question 18. (Use a graph paper for this question). The daily pocket expenses of 200 students in a school are given below:

Draw a histogram representing the above distribution and estimate the mode from the graph.
Solution:
Histogram is as follows:

Draw two lines AC and BD intersecting at E in the uppermost rectangle, which denotes modal class. Draw a perpendicular to the x-axis from E to L. The mode is determined by the value of L. As a result, mode = 21.5.
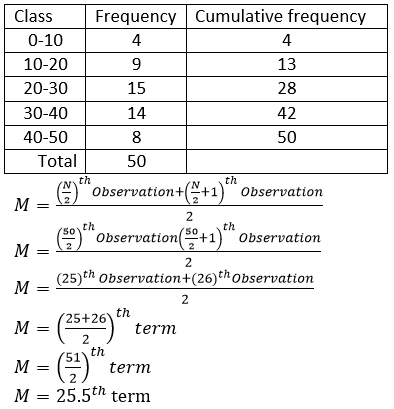
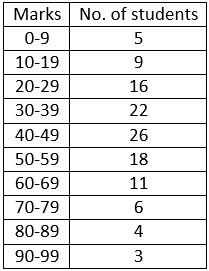
Question 19. The marks obtained by 100 students in a mathematics test are given below:
Marks 0-10 10-20 20-30 30-40 40-50 50-60 60-70 70-80 80-90 90-100
No. of students 3 7 12 17 23 14 9 6 5 4
Draw an ogive for the given distribution on a graph sheet. Use a scale of 2 cm = 10 units on both the axes.
Use the ogive to estimate:
(i) Median
(ii) Lower quartile
(iii) Number of students who obtained more than 85% marks in the test.
(iv) Number of students failed, if the pass percentage was 35.
Solution:

(i) Median:-
Here N (count of number) is 10 even numbers.
𝑀 = (𝑁/2)𝑡ℎ
𝑂𝑏𝑠𝑒𝑟𝑣𝑎𝑡𝑖𝑜𝑛
𝑀 = (100/2)𝑡ℎ
𝑂𝑏𝑠𝑒𝑟𝑣𝑎𝑡𝑖𝑜𝑛
𝑀 = 50𝑡ℎ 𝑂𝑏𝑠𝑒𝑟𝑣𝑎𝑡𝑖𝑜𝑛
Plot 50 on the y-axis, draw a line parallel to x-axis meets the curve at A. Meets the curve at A, and draw a
perpendicular to x-axis, which meets x- axis to B. The value of B is the median which is 45.
(ii) Lower Quartile:-
Here N (count of number) is 10 even numbers.
𝑄1 = (𝑁/4)𝑡ℎ
𝑂𝑏𝑠𝑒𝑟𝑣𝑎𝑡𝑖𝑜𝑛
𝑄1 = (100/4)𝑡ℎ
𝑂𝑏𝑠𝑒𝑟𝑣𝑎𝑡𝑖𝑜𝑛
Question 20. The mean of following numbers is 68. Find the value of ‘x’. 45, 52, 60, x, 69, 70, 26, 81 and 94.
Hence, estimate the median.
Solution:

By cross multiplication,
68 × 9 = 497 + 𝑥
612 = 497 + 𝑥
−𝑥 = 497 − 612
𝑥 = 115
The value of 𝑥 is 115.
Hence, the data is 45, 52, 60, 115, 69, 70, 26, 81 and 94
Arrange the data in ascending order 26, 45, 52, 60, 69, 70, 81, 94, 115.
Here N (count of number) is 9 odd numbers.

Question 21. The marks of 10 students of a class in an examination arranged in ascending order are as follows:
13, 35, 43, 46, x, x + 4, 55, 61, 71, 80. If the median marks are 48, find the value of x. Hence, find the mode of the given data.
Solution:
Given that the median marks of 10 students are 48.
Here N (count of number) is 10 even numbers.

48 × 2 = 2𝑥 + 4
96 = 2𝑥 + 4
96 − 4 = 2𝑥
92 = 2𝑥
𝑥 = 92/2
𝑥 = 46
Hence, the data is 13, 35, 43, 46, 46, 50, 55, 61, 71, 80.
Here, 46 occur 2 times which is maximum frequency, so the mode is 46.
Question 22. The daily wages of 80 workers in a project are given below.

Use a graph paper to draw an ogive for the above distribution. (Use a scale of 2 cm = Rs. 50 on x – axis and 2 cm = 10 workers on y – axis). Use your ogive to estimate.
(i) The median wages of the workers.
(ii) The lower quartile wage of workers.
(iii) The number of workers who earn more than Rs. 625 daily.
Solution:
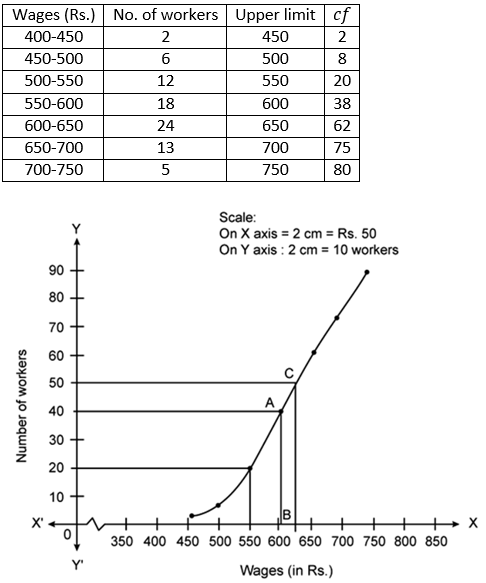
𝑀 = (𝑁/2)𝑡ℎ
𝑂𝑏𝑠𝑒𝑟𝑣𝑎𝑡𝑖𝑜𝑛
𝑀 = (80/2)𝑡ℎ
𝑂𝑏𝑠𝑒𝑟𝑣𝑎𝑡𝑖𝑜𝑛
𝑀 = 40𝑡ℎ 𝑂𝑏𝑠𝑒𝑟𝑣𝑎𝑡𝑖𝑜𝑛
Plot 40 on the y-axis, draw a line parallel to x-axis meets the curve at A. Meets the curve at A, and draw a
perpendicular to x-axis, which meets x- axis to B. The value of B is the median which is 605.
(ii) Lower Quartile:-
𝑄1 = (𝑁/4)𝑡ℎ
𝑂𝑏𝑠𝑒𝑟𝑣𝑎𝑡𝑖𝑜𝑛
𝑄1 = (80/4)𝑡ℎ
𝑂𝑏𝑠𝑒𝑟𝑣𝑎𝑡𝑖𝑜𝑛
𝑄1 = 20𝑡ℎ 𝑂𝑏𝑠𝑒𝑟𝑣𝑎𝑡𝑖𝑜𝑛
Plot 20 on the y-axis, draw a line parallel to x-axis meets the curve at A. Meets the curve at A, and draw a
perpendicular to x-axis, which meets x- axis to B. The value of B is the lower quartile which is 550.
(iii) Number of workers who earn more than Rs. 625 daily are 80 – 50 = 30.
Question 23. The histogram below represents the scores obtained by 25 students in a Mathematics mental test.
Use the data to:
(i) Frame a frequency distribution table.
(ii) To calculate mean
(iii) To determine the Modal class

Solution: